

Key points:
- We present preliminary estimates of areas that are more likely to have experienced complete damage to buildings in the Mw 5.7 Jajarkot earthquake of 3 November 2023.
- The earthquake was likely to have caused complete damage to buildings in approximately 10 districts centered on the area of greatest shaking. In each of these districts, the modelled number of completely-damaged buildings ranges from several hundred to several thousand per district.
- The greatest impacts to buildings were likely to have occurred in Jajarkot, Rukum West, Dang, Surkhet, and Salyan districts. Lesser impacts were likely in Bardiya, Dailekh, Kailali, Kalikot, and Banke districts.
- The maps should be used to identify focus areas for initial assessments and relief or recovery efforts, as well as areas that may have been overlooked in the initial response. They are not meant to replace observations and reports of impacts from the field.
- There are important uncertainties in modelling the impacts from moderate earthquakes such as this one, due partly to uncertainty in the pattern of ground accelerations, and also to the shape and uncertainty in the fragility curves that are used to relate earthquake shaking to likely building damage. Model results can also be combined or presented in different ways, which will change the interpretations that can be drawn from them. The maps should therefore be used as an overall guide to the possible impacts from the earthquake, but we caution against making interpretations of the detailed patterns or numbers of modelled impacts.
On 3 November 2023 an earthquake of moment magnitude (Mw) 5.7 occurred in Karnali Province in western Nepal. At the request of the UN Resident Coordinator’s Office in Nepal, the Sajag-Nepal team applied a network-based multi-hazard impacts model that has been developed in the project to estimate the number of buildings that were potentially damaged by the earthquake, as well as their distribution across the affected area. The model uses open-source data on building locations from OpenStreetMap as well as publicly-available information on building types and their fragility – in other words, how likely different building types are to be completely damaged by a certain level of earthquake shaking – from the METEOR project. The peak ground accelerations in the earthquake were taken from the US Geological Survey summary page for the event. The model estimates the likelihood that buildings in each administrative area were completely damaged by shaking in the earthquake. This allows us to make a preliminary ranking of areas that are more likely or less likely to have been affected. To allow for variations in construction quality, we use high, medium, and low fragility curves for each building type. This results in three different sets of results, and we don’t know beforehand which of these is more appropriate for a given area. These sets of results can be thought of as a ‘best case’, a ‘worst case’, and an ‘intermediate case’ of earthquake impacts on buildings.
Because we don’t know the type, and thus the fragility, of every individual building, we need to combine the results by area in some way. We could do this in several different ways, and our choice here affects the specific results that we get. First, we have simply added up the estimated probability of complete damage for all buildings within a municipality (gaun palika or nagar palika in the Nepali federal system), and used that sum to rank the municipalities from high to low. This sum is an indicator of the total number of buildings that are likely to be damaged. For example, if there are two buildings in an area, each with a modelled probability of complete damage of 0.5, then, on average, we would expect one of those buildings to be damaged in any given scenario (2 x 0.5 = 1 building). It’s important to point out, however, that a high sum total for a municipality could be due to a small number of buildings with high individual likelihood of complete damage, or to a large number of buildings with moderate likelihood of complete damage.
The map below shows the ‘worst case’ results from the model, using the high fragility curves, and indicates the municipalities that are more likely to have been affected by earthquake shaking, at least in terms of building damage. The medium and low cases produce similar overall patterns:
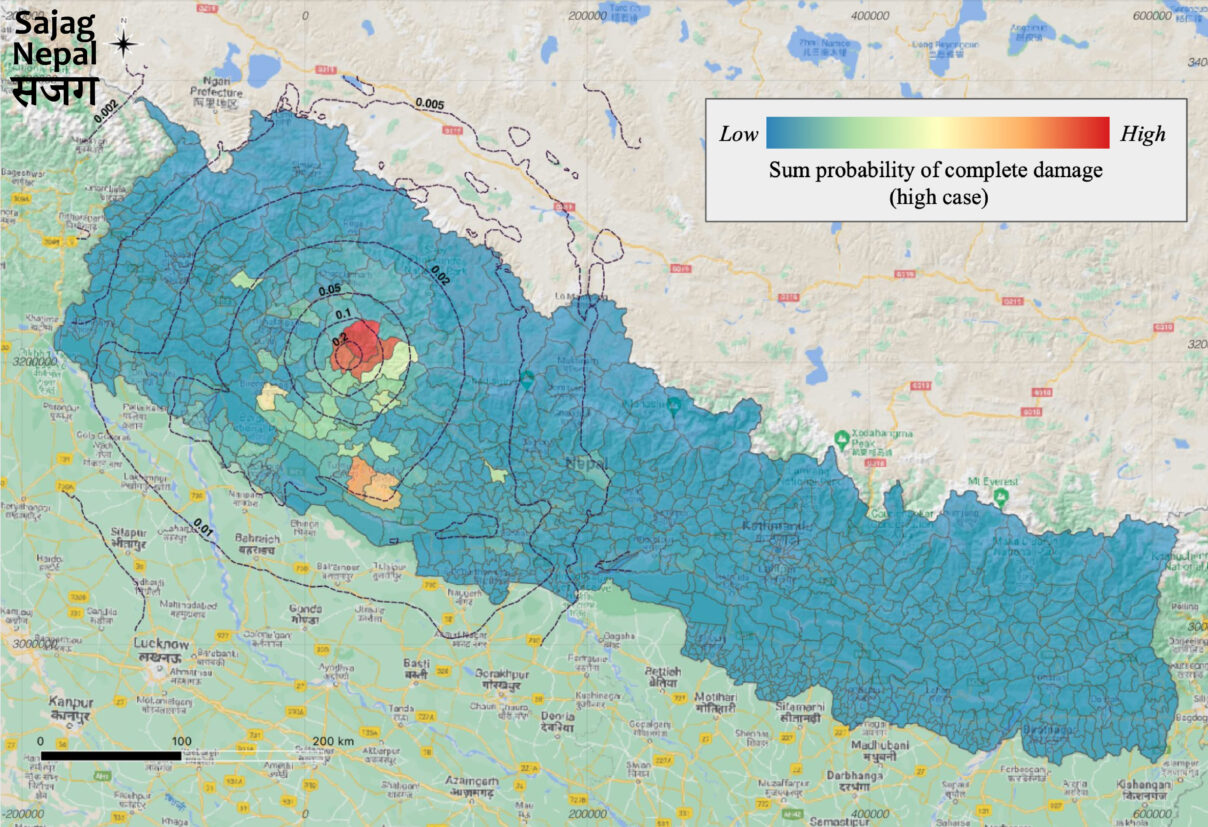
The contours show peak ground accelerations from the US Geological Survey, in units of gravitational acceleration g. You can see that the highest-ranked municipalities – that is, the areas with the largest summed probability of complete damage – are those in Jajarkot and Rukum West districts, where the shaking was greatest. There are also moderately high values to the south, in more populated municipalities close to the Indian border (for example in Dang district). We can’t tell from this map whether those are due to high likelihood of complete damage, or just to larger numbers of buildings in those areas.
We can also sum the results by district, which is a larger administrative unit. Here are the estimated numbers of completely-damaged buildings by district, showing the difference between the high, medium, and low cases. For clarity, we have limited this to the top 10 districts only:
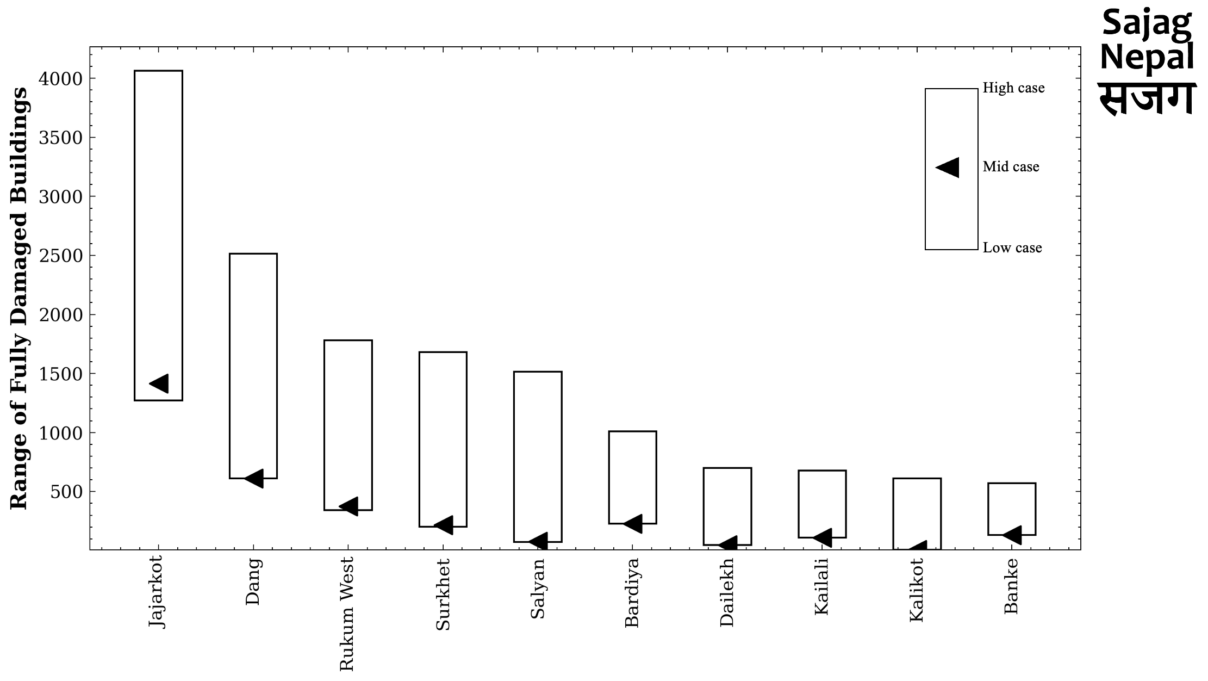
Each bar shows the range of model outcomes when we consider the high case (top of bar), low case (bottom of bar), or medium case (triangle). The districts are ordered by the modelled number of buildings in the high case. You can see that, for all districts, the low and medium cases give very similar numbers. This is because of the shape of the fragility curves for adobe and stone-masonry buildings, which together make up most of the modelled damage. At the comparatively low peak ground accelerations experienced in the earthquake (less than 0.2 g over much of the area), there is little difference between the low and medium fragility curves, so the modelled numbers of buildings are similar. It’s also important to point out that the fragility curves for these building types rise very steeply at higher accelerations, so the results are extremely sensitive to the details of the acceleration contours in the maps above.
Alternatively, we can calculate the average likelihood of complete damage across all buildings in a municipality, and use that to rank the municipalities from high to low. This approach is less affected by areas with large numbers of buildings, but conversely might lead us to overlook areas with a small proportion of highly-affected buildings:
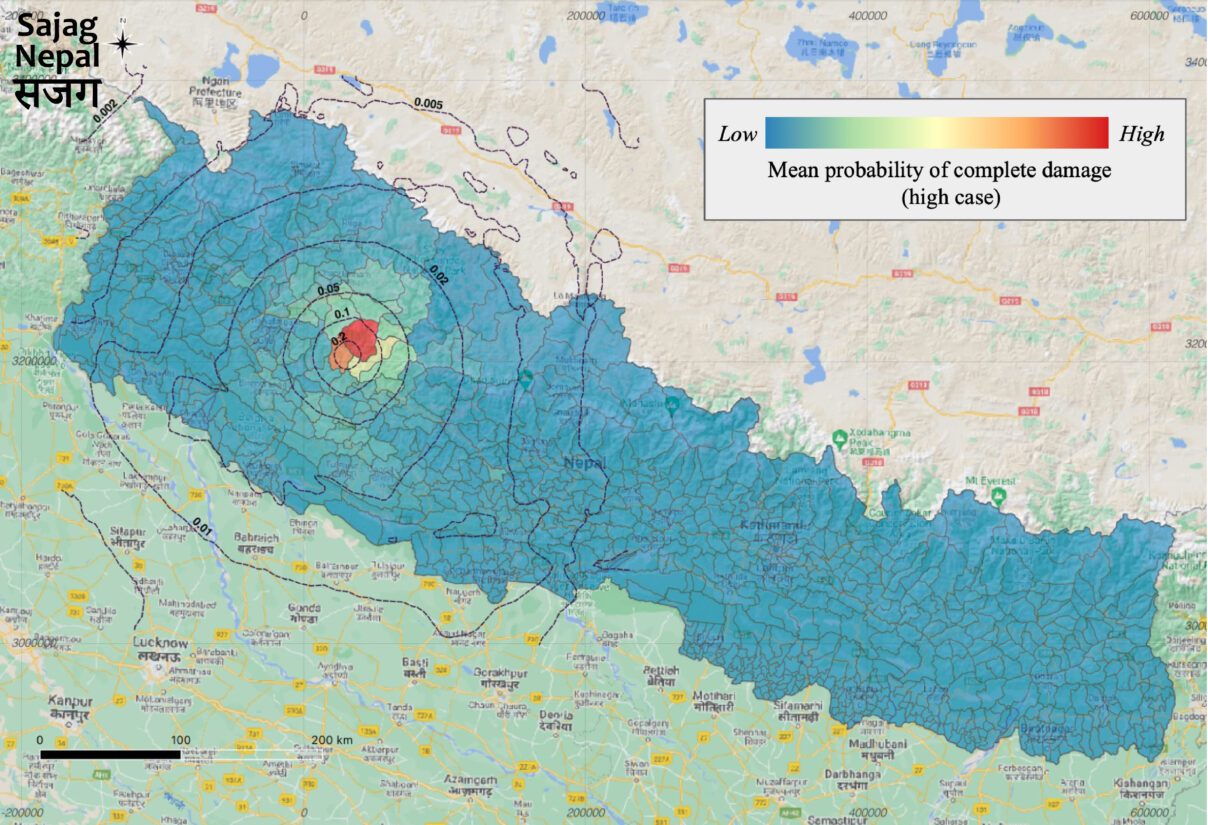
You can see that now the pattern is much more restricted to Jajarkot and Rukum West districts, near the area of greatest shaking. The municipalities to the south are less obvious in this map – despite their larger numbers of buildings, the likelihood of damage to individual buildings is smaller.
The model also allows us to estimate the likelihood of building damage by landsliding or debris flows triggered by the earthquake. Because of its relatively moderate size, the earthquake was unlikely to have triggered large numbers of landslides – unlike, for example, the 2015 Gorkha earthquake. This inference is supported by the model, which shows that the likelihood of individual road segments in the area being impacted by landslides was at most about 0.4%. It is also consistent with initial situation reports from UN OCHA, which noted only limited landslide impacts to the road network. Some small landslides had been documented in Jajarkot district by UNOSAT as of 7 November (see here for details), but as far as we are aware there has not been any systematic landslide mapping to date.
We stress that the results reported here should be viewed as preliminary estimates of areas that are more likely to have experienced complete damage to buildings. They should be used to guide more detailed assessments in the coming days and weeks, but they should not be used on their own to guide decisions about response or relief efforts, and they should not replace observations and reports of impacts in the field. We will continue to work with the UN Resident Coordinator’s Office to refine and update these results.
For questions or further information, please contact Dr Alexandre Dunant, Durham University ([email protected]).